North Korea tested a powerful nuclear device over the weekend, and it intends to mount this weapon on an intercontinental ballistic missile (ICBM) that can reach the U.S.
U.S. intelligence suggests that North Korea tested either a staged thermonuclear bomb or a boosted-fission device with an explosive yield around 150 kilotons, U.S. government sources toldThe Diplomat. Prior to the test, North Korearevealedimages of a new thermonuclear warhead for its Hwasong-14 ICBM, which canstriketargets across part, if not most, of the continental U.S.
North Korea called its nuclear test a “gift package” for the U.S., using wording it previously used to describe its ICBM.
It is difficult to fully grasp the explosive and destructive power of a nuclear weapon, but an interactive tool recommended by some North Korea experts offers valuable insight.
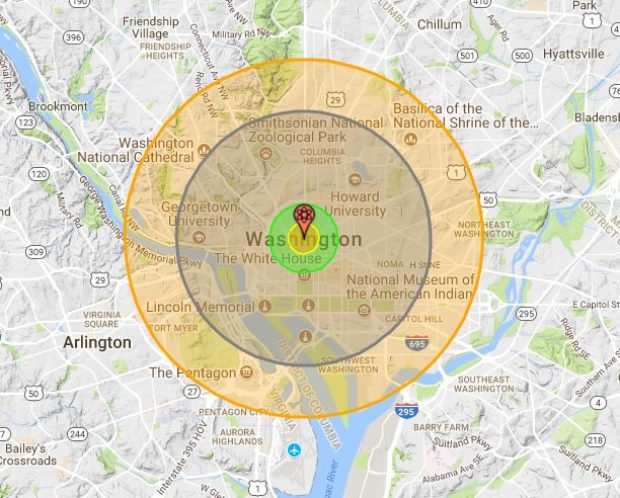
NUKEMAP, created by Alex Wellerstein, a nuclear historian, allows users to see the impact of a nuclear blast on any city anywhere in the world. The casualty numbers are, according to the creator, evocative, not definitive. Using this tool, it is possible to examine the impact of North Korea’s new bomb on American cities if it was detonated in the air a little under a mile above.
Washington, D.C.:
Estimated fatalities: 263,450
Estimated injuries: 442,060

NUKEMAP by Alex Wellerstein, Map data ©2017 Google
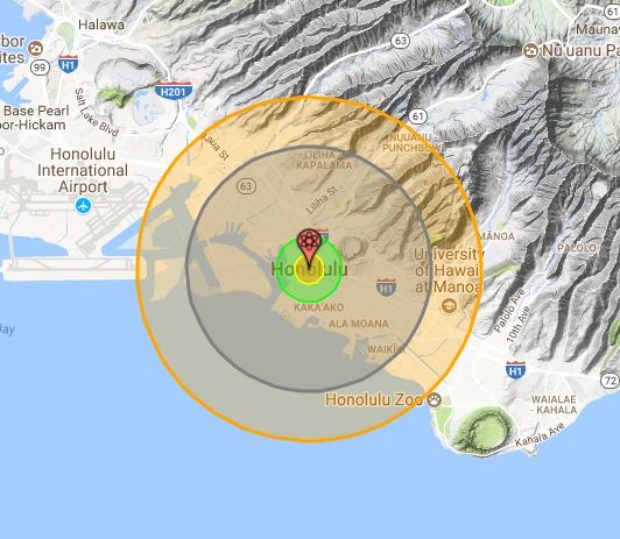
The fireball (yellow, center) would cover an area of roughly 0.25 square miles. The air blast (grey) would bring destruction to an area of 16.9 square miles. Radiation (green) would affect an area of 1.22 square miles, and thermal radiation (orange), causing third-degree burns, would cover an area of 33.5 square miles. This impact would be roughly the same for all other cities, with only the casualty figures changing dramatically.
Wellerstein encourages users “to take these numbers with a grain of salt,” adding that “they give some indication of how many people live in reasonably close proximity to the selected ground zero.”
“The numbers might be too high. They also might be too low,” he explains on his website. “Without taking into account many more variables than the model can deal with, like terrain type, building type, expected reaction of the bombed populace, and radioactive fallout, it’s hard to do anything more than gesture at the numbers that would be affected by a nuclear explosion.” Regardless, this is one of the clearest indications of the reality America faces as North Korea develops more powerful nuclear weapons and the means to deliver them to distant targets.
New York City:
Estimated casualties: 728,220
Estimated injuries: 1,562,410

NUKEMAP by Alex Wellerstein, Map data ©2017 Google
Chicago:
Estimated casualties: 315,160
Estimated injuries: 525,340

NUKEMAP by Alex Wellerstein, Map data ©2017 Google
Seattle:
Estimated casualties: 154,060
Estimated injuries: 210,960

NUKEMAP by Alex Wellerstein, Map data ©2017 Google
Los Angeles:
Estimated casualties: 241,100
Estimated injuries: 629,670

NUKEMAP by Alex Wellerstein, Map data ©2017 Google
San Francisco:
Estimated casualties: 227,400
Estimated injuries: 407,550

NUKEMAP by Alex Wellerstein, Map data ©2017 Google
Honolulu:
Estimated casualties: 142,600
Estimated injuries: 167,700

NUKEMAP by Alex Wellerstein, Map data ©2017 Google
Send tips to ryan@
Content created by The Daily Caller News Foundation is available without charge to any eligible news publisher that can provide a large audience. For licensing opportunities of our original content, please contact licensing@dailycallernewsfoundation.org.

No comments:
Post a Comment